Fall 2005
Details on the Trace project debugging user interface
One of the useful tools we are providing with the Trace project is a debugging interface, which you can use to experiment with tracing individual paths through the scene and visualize exactly what is going on with your code. This is meant to be an introduction to the capabilities of this UI.
The first thing you should note is that the UI is already there and ready for you; you don't have to do anything to enable it.
All you have to do is load a scene file and toggle the "Debugging display" check box to open the debugging window.
Every time you call Scene::intersect, the ray and its intersection is cached so that it can be displayed. As long as you always use this method to cast rays, they will hence be displayed (including shadow rays, if you use this method in your shadow-handling code). The only thing you have to do is when you are creating the ray that will be traced, identify what kind of ray it is (the options are REFLECTION, REFRACTION, VISIBILITY, and SHADOW). The cache is cleared out at the top-level RayTracer::trace, so that when you view traced rays in the debugging window, only the ones for a particular pixel are shown.

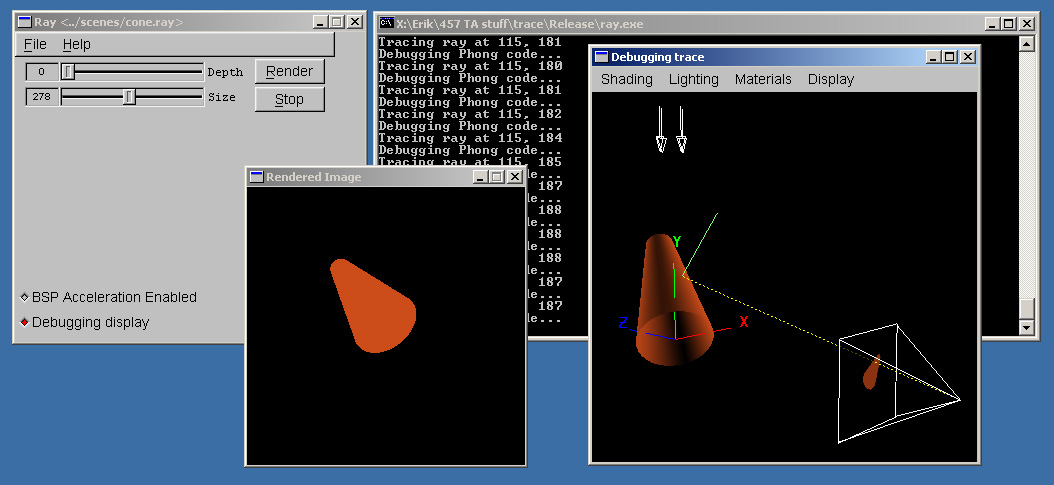
This is what you will see when you enable the debugging view with the skeleton code. You will notice a number of features, each of which can be turned on or off using the "Display" menu:
- A camera, which shows the center of projection and the projection
plane (for clarity, the rendered image appears on the projection
plane itself)
- The scene origin, with positive x, y, and z axes shown.
- Two directional lights (these are the groups of arrows).
Each is colored with its actual intensity.
If the scene had point lights, these would also show up.
- The yellow dotted line is a traced ray. At the place where it
intersects with the cone, the normal is shown in green. Note
that the UI takes the normal information from what is stored in the
isect class; if you calculate your normals wrong
when you are calculating intersections, they will appear
incorrect in the debugging view as well.
Notice also that even though the skeleton code does not have Phong shading
enabled, the debugging view does. This is, of course, because the debugging
display uses OpenGL for all of its shading. This has a few connotations:
- You can use the same controls to zoom around in the window that you
used in the Modeler project.
- OpenGL does not support reflection and refraction. You will no doubt
find the UI a valuable tool for debugging your reflection and refraction
code, since you can easily see where your reflected and refracted rays
are going, but you will not be able to see the refraction effects in
the debugging view itself. Use the sample raytracer to see what the
results should look like.
- If you introduce your own primitives, they won't appear in the debugging
window. You are welcome to write your own "glDrawLocal" method if
you feel this will help in debugging. Model it after the ones in
ui/glObjects.cpp.
Now, as described above, you can easily move in and around the scene using
the controls that you should be familiar with from Modeler. In order to
get the full use of the debugging window, you should use the
Rendered Image window to trace individual rays. Simply clicking on a
pixel in the image window will cause the raytracer to trace rays through that pixel to the
maximum depth specified by the depth slider. Additional tips:
- You have a variety of shading options. In particular, "wireframe"
will let you see through the opaque surfaces, which will
be helpful when you're debugging refraction.
- You can either use the default debugging lighting
(which illuminates everything so that you can see it)
or turn on the actual
scene lighting if you're trying to debug the lighting code.
- Same as above for materials; this may be helpful if the materials
in the scene aren't showing up well in OpenGL.
- You can turn on and off any elements of the scene you want. In
particular, you can enable/disable any individual kind of ray, if
you only want to see visibility rays. Shadow rays are disabled
by default, and if enabled they show up in blue. But they won't
show up at all if you aren't labelling your rays correctly, or
you don't use the
scene->intersect function.
- Objects will show up in the debugging window even if you haven't yet
written the intersection code that allows the objects to be rendered in
the Rendered Image window. So you can use the debugging window to get
a feel for what a scene should look like once you have your intersection
code working.
Known issues
One problem you may encounter is that the camera code for the debugging
view uses heuristics to determine what should be a good view of the scene.
This seems to be correct for most reasonable scenes, but there may be scenes
where you find that the heuristics fail and the scene itself starts out
entirely out of the view frustrum. You should be able to maneuver it back in
if this happens.
And if you try to open the debugging window without first loading a scene
file, the program will crash. Just make sure you have a scene file loaded first.


